Hazards present on a facility will have been identified in a hazard study (e.g., HAZID) and the results are used as the starting point to identify the scenarios to include in the QRA. The hazard study will usually have ranked qualitatively the expected frequency and likely consequences of the identified hazards so that the QRA can focus on the significant hazards only. All parts of the plant that contain a hazardous material (either toxic, FIGURE 1 – QRA PROCESS flammable or both) should be included in the QRA. This could result in hundreds of different scenarios, so to simplify the analysis, the facility is split into sections (sometimes called isolatable sections) that contain similar materials under similar process conditions such as pressure and temperature.
What is QRA
QRA is a technique used to systematically calculate the risks from hazardous events. It involves predicting the size of consequences associated with a hazard, and the frequency at which a release of the hazard may be expected to occur. These aspects are then combined to obtain numerical values for risk – usually risk of fatality. QRA includes consideration of all identified hazardous events to quantify the overall risk levels. Similar hazardous events are often grouped and assessed together as bounding or representative events.
Objectives of the QRA
The objectives of QRA are:
- To identify hazards and quantify the risks related to the transport, handle, and storage of P&FM.
- To recommend practical measures to reduce the hazards and risks to as low as reasonably practicable.
- To establish (where applicable) Health & Safety (H&S) buffers to guide land use planning; and
- To use for information sharing and emergency planning purposes.
Methodology
The main steps involved in a typical QRA study are shown in the figure below. This also indicates how the outputs of each part feed into the next step of the process.
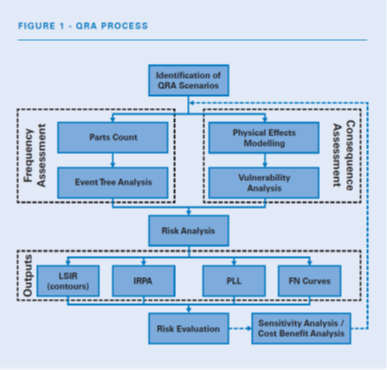
main steps
To calculate the frequency of releases from an isolatable section involves counting the equipment items in each section (as shown on the P&ID) and multiplying by equipment release frequencies from published databases. A range of hole sizes is required to obtain a spread of results and provide a realistic representation of the range of release sizes that could occur. The many possible sequences that may result from these loss of containment releases is developed using event tree analysis, which considers probabilities for ignition and failure of protection systems. The frequencies of non-process hazards such as ship collision or dropped objects are usually derived directly from incident data or using fault tree analysis.
A variety of models are available to estimate the consequences of the resulting fires, gas dispersion, explosions, etc. The vulnerability of people to these physical effects is determined in terms of probability of fatality using appropriate criteria. The consequence assessment will also identify potential escalation scenarios that may lead to further significant consequences. A QRA may also consider the impact on the asset itself, the environment, and the reputation of the company.
The consequences and frequencies are then combined in an integrated QRA model to give numerical risk values. Offshore QRA is usually conducted using spreadsheets whereas onshore QRA is typically done with commercially available software. Other non-process hazards also need to be analyzed, such as personnel transport, occupational hazards, ship collision, aircraft impact and natural hazards. Each has its own specialist method for risk analysis. The calculated risk values are summed for all possible outcomes and expressed in the required form. Offshore risk is usually expressed in terms of Individual Risk Per Annum (IRPA) and Potential Loss of Life (PLL), whereas onshore risk will typically calculate Location-Specific Individual Risk (LSIR) and FN-curves for societal risk considerations as well as IRPA.
The significance of the calculated risk levels is evaluated by comparing them with country and company risk acceptance criteria. The most significant contributors to the total risk are also identified to enable improvement measures to be targeted at those factors where the greatest risk reduction is likely to be gained. Cost-Benefit Analysis (CBA) is a complementary tool to QRA and may be used to rank risk reduction options in order of cost-effectiveness. QRAs have many sources of uncertainty, whether in the data, methods, or assumptions, and these need to be understood through a targeted study that can inform the interpretation of the QRA results.
Software and Standards
An array of third-party software packages exists (such as DNV Safeti) for carrying out consequence modelling, frequency assessment or entire QRAs, but many of these calculations are also often done using spreadsheets.
Results and Recommendation
The final task of a quantitative risk analysis is usually risk assessment. This step evaluates the information generated by the analysis and assesses the magnitude or acceptability of the risk posed by the facility. It uses the consequence analysis and probability analysis results, risk con-tours, f/N curves, or other measures of risk to compare to internal (e.g., corporate) or external (e.g., regulatory) criteria for acceptability. If the facility is under the jurisdiction of a rule-making authority that has risk acceptability criteria, the calculated risk will be compared directly to those criteria. For an analysis performed for a facility in a country that does not have quanti¬tative risk acceptance criteria, such as acceptable individual risk levels or acceptable societal risk (f/N) levels, a comparison to published standards for other countries may help in the assessment of risk.
• Explosion Risk Analysis (ERA)
• Dropped Object Study
• Ship Collision Study
• SSIV Requirement Study
• Flare Radiation, Dispersion & Noise
• AIV & FIV Analysis
• Deflagration Study